
As with all PLC environments, being “Online” is an important aspect.
The difference between “Online” and “Offline” is that when your connected to a PLC and online, you are able to see variable values, diagnostic data and issue commands such as PLC Timeclock updates and even stopping / starting the PLC.
Getting Online In TIA Portal

In nearly every single view in TIA Portal, it is possible to Go Online. The above image shows 3 different places to Go Online. There are even instances where TIA Portal will go online for you automatically as your intent is to view a live system.
You can Go Online in a variety of ways:
- Click Go Online from the top menu:
- Click Go Online from the right-click context menu:
- You’ll need to have a PLC selected in the Project Tree, or a dependant of the PLC

- Click Go Online from the Online & Diagnostics view
- Click the Monitoring On/Off button whilst Offline in any Block view
TIA Portal will perform 1 of 2 things when one of the above is executed:
- Go Online without issue
- Prompt for communication configuration
Configuration Of Communication

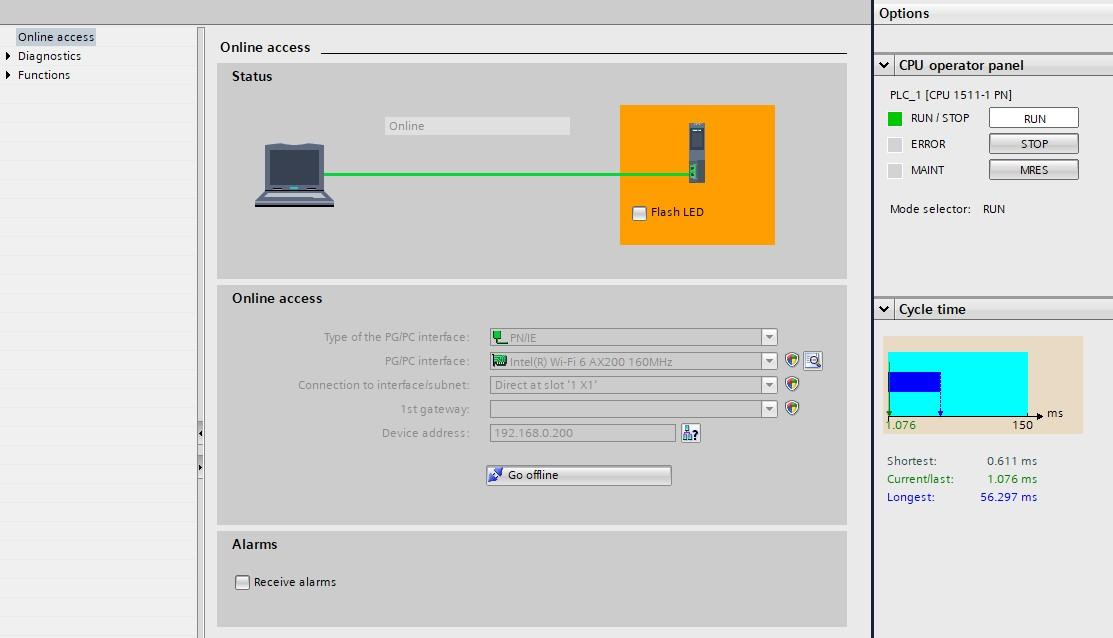
If you’ve never connected to a PLC before, the window above will appear. This can be used to configure how your laptop / PC will connect to the target PLC.
The image above shows that we’re looking for the IP address 192.168.0.200. So the first thing to ensure is that the laptop you are connecting with is on the same IP subnet (192.168.0.X).
Use the Type of the PG/PC interface option to select how you are communicating. In almost all cases now days, this will be PN/IE
The PG/PC interface option will allow you to select the interface your laptop is using. For me, this is Intel(R) Wi-Fi 6 AX200 160MHz, but you may well be using an Ethernet Connection (I just have everything on WiFi in my home-office)
In most cases Connection to interface/subnet will be Direct at slot '1 X1' and you may or may not need a gateway depending on your network setup

If you know the IP address of the PLC you are targeting (which we do in this case), then select Show devices with the same addresses. Otherwise you can search for the PLC using the other two options.
If you are using a VPN / Tunnel, you won’t be able to search for the PLC unless your access point is “Layer 2” compatible.
If you don’t know what this means, then don’t worry, just make sure you use Show devices with the same addresses and have the IP address of your project set correctly

After clicking Start search, if the PLC is contactable, it will be listed in the Select target device list.
Clicking GoOnline at the bottom of the dialogue will begin the “Going Online Process”
How Do I Know I’m Online?
There are a few different ways to tell you are actively connected to a PLC
The first is that the status bar on the bottom right of TIA Portal states you are connected:

A moving orange bar indicates you are online also.
The second is that the Project Tree shows status icons next to all of the objects:

These icons show correlation statuses between your offline project and the online PLC. If there are differences, then different icons are displayed:

Going Offline
This is simple, click the Go Offline button from the top bar.
You may also be asked if you want to go offline when you stop monitoring the last monitored block. You can turn this feature off in the settings if it gets annoying!
Online Diagnostics
The online diagnostics tool is great for discovering why there is an issue present with your PLC and/or configuration.
You can find the Online & diagnostics object in the Project tree under the PLC you wish to diagnose.

Depending on the PLC in your project, different options may be available to you
There are many different diagnostic tools within the Online & diagnostics view, but some are more important than others
The tools of most interest are:
- Diagnostics
- General
- Diagnostics Buffer
- Cycle Time
- Memory
Whilst the other tools have their uses, for day-to-day issues, the above is more likely to be required.
General

The General view from the Diagnostics list gives an overall view of the PLC’s important aspects
This includes Firmware, Catalog Number (Article number), TIA Portal Version
Module information and manufacturer information is also provided
None of the fields on this page are editable, they are there for viewing only.
Note: This information is handy when talking to Siemens support!
Diagnostics Buffer

This is probably the most useful view of them all.
If the PLC ever has issues where the PLC fails to start up, or a connected device malfunctions, this is the place diagnostic data will be captured
You can highlight a message and gain more insight into what it means. You can even jump to the code where the error originated from by clicking “Open in editor”
Cycle Time

The Cycle Time view allows you to monitor how the PLC is performing from a Cycle Time (Scan Time) point of view
You can also view any cycle configurations set on the PLC such as minimum cycle time or cycle monitoring time
This view is also displayed on the Online Tools to the right of TIA Portal
Memory

Memory is something that is always worth keeping an eye on.
This view allows you to check you’re not close to hitting the maximum the PLC can handle
Functions
The Functions section allows you to Set Time and perform a Firmware Update, amongst other options.
When working in the Functions section, remember that you are connected to an online and live PLC. If you go ahead and Reset to factory settings, you’ve just stopped and cleaned that PLC!
Check Out Another Post

TIA Portal Basics – Working With Variants
Example Of A Single Block Accepting 2 Different Data Type Inputs Using Variants The Variant data type is a special…